 Display Configuration (dConf) :
A number of different display or logging devices may be connected to a Tech Edge wideband controller.
This section of WButil, called dConf allows each of the four display's
views, comprising both digits and bargraphs, to be individually set up.
Display Configuration (dConf) :
A number of different display or logging devices may be connected to a Tech Edge wideband controller.
This section of WButil, called dConf allows each of the four display's
views, comprising both digits and bargraphs, to be individually set up.
As this is a complex, but logically organised operation, there are a number of sub-tabs that
neatly divide the task into manageable smaller tasks starting from
the General tab, the Views, Tables, and EE tabs.
A test configuration can be immediately tested without actually connecting to a real wideband unit - this
uses WButil's inbuilt emulator.
Information collected on a wideband controller (λ/AFR, voltage and pulse inputs, etc.) are transmitted to a remote display using a serial (RS232) data-frame. The display must extract data-fields from the data frame, then format that data and then display it. How the data is formatted and manipulated is controlled by values stored in EE configuration memory. The process of configuring the display amounts to modifying the contents of the display's EE config memory.
It's important to understand that configuration of the display primarily occurs on the display device itself.
Different displays have different capabilities so the type of display must be selected.
But the data-frame is generated by another device and sent to the display.
And the data-frame sending device (wideband unit, data collector, etc.) can often be re-programmed to send a different frame.
So, apart from selecting the correct display, dConf must first be told what the data
frame contains, and second, if necessary, the sending device must be re-programmed to send that frame.
To make things easier, pre-defined frame formats are available to dConf from one of the configuration files
(dConf.ini in the installation directory).
The image at left shows that the display device has been selected as LA1
(selected in the General tab)
and the frame has been selected as from a 2J1 controller.

In theory it should be possible to configure a display from scratch, but it's better to start with the display configuration you have, or the one that we supply with the display. A display configuration can be loaded from the display itself (via the COM port), or from the display's HXF file, or previously saved copy of the display's EE config memory. Note that by default, the last edited data is reloaded.
Now it's time to get some first hand experience.
 Get the latest copy of WButil from here.
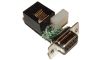
If you want to save a configuration into a real display then you'll also need
the display adaptor shown at right, and explained more here.
Get the latest copy of WButil from here.
If you want to save a configuration into a real display then you'll also need
the display adaptor shown at right, and explained more here.
Go to the Display Config tab and select the General sub-tab - you should have the basic screen as shown at left but with no fields selected.
Now, using the [File ...] button, navigate to the HXF file for your display. Press the [Read] button and the display should change to look similar to the image at left.
We have to customise the configuration for your controller. From the drop-down menu with label Frame Is, select 2.1 frame or a frame-type that most closely matches your controller (in the image, 3H1 has been selected).
| Type | Applies to these devices |
| 2.0 frame | 2A0, 2A1, 2Y1 |
| 2.1 frame | 3A1, 3A2, 3B1, 3E1, 3E2 |
| 2E0 | 2E0 |
| 3H1 | 3H1 |
| 2J1 | 2J1 |
There are four selectable sources (see the Serial Data Stream box at the left) numbered 1 to 4. These four sources are extracted from the serial data stream from the controller and are made available for further processing and later display. The image shows source 2 is User 1 and source 4 is RPM.
To the right of the four selectable sources there are two fixed sources that should be preset to Thermistor (if present on the controller) and WB Status (ie. the fields are the same names as their labels). These should not (normally) be changed.
Below these two are Filter Src. A and Filter Src. B which are two additional fields selected from the data stream. These two fields are ONLY available to be used as inputs to the two filters. In the image, the 3H1 (a dual channel device) has been set to extract Ipx channels 0 and 1 (ie. AFR/L ch 0 Ipx and AFR/L ch 1 Ipx).
 Quantities to be displayed are usually filtered before being processed - this prevents the values, that may have large noise components, becoming hard to read.
There are three filters, Filter 1, Filter 2 and a local Analog Filter,
each with two outputs that are available for driving the digits and the bars independently.
The Filter Sources box, and the Filter Coefficients box (see the image at right)
allow the filter sources to be selected and the amount of filtering set.
Quantities to be displayed are usually filtered before being processed - this prevents the values, that may have large noise components, becoming hard to read.
There are three filters, Filter 1, Filter 2 and a local Analog Filter,
each with two outputs that are available for driving the digits and the bars independently.
The Filter Sources box, and the Filter Coefficients box (see the image at right)
allow the filter sources to be selected and the amount of filtering set.
Filter 1 & 2 Inputs are set by selecting a menu item from the list with heading Filter x Uses. The available filter sources are made up of:
The Analog Filter input is a voltage input physically local to the display and therefore its source cannot be changed. However, its name can be changed from the default shown to make it easier to use when setting up the views.
 All three filters can be set. There are two filter values per filter, one value for the digits and one for the bars.
This lets us set (for example) the bars to have little filtering so fast activity can be seen, but the corresponding digits can have more filtering so it's readable.
A small filter value results in very fast filtering and a maximum value of 255 gives the largest filtering.
The default filter values give very readable displays that may be on the slow side for only a very small percent of viewers.
All three filters can be set. There are two filter values per filter, one value for the digits and one for the bars.
This lets us set (for example) the bars to have little filtering so fast activity can be seen, but the corresponding digits can have more filtering so it's readable.
A small filter value results in very fast filtering and a maximum value of 255 gives the largest filtering.
The default filter values give very readable displays that may be on the slow side for only a very small percent of viewers.
Large filter values can give the impression of a lag between the value changing and it being seen to change - this is an unfortunate but inevitable consequence. Note that the display update rate can be independently set and is quite different to the filter coefficients in its effect. You can change the filter coefficients and see the effect by using the emulator and rapidly changing the displayed values with the slider.
A number of parameters that apply to all views are set in the Conversions box.
Linear Conversions take a source-value (either a local value or a data value extracted from the serial frame) and apply a straight line (y = mx + c) conversion. The Lin. Offset acts a little like the c and Lin. Scale is a little like m. An easier way to define the linear conversion is by directly changing the Start and End values. Start & End are in display units.
Local VSS Divisor
Frame RPM Divisor
Note that for the text programmed here to work, the view's Limit Text must be set to User's Limit Text (see more here).