

| Updated CONFIGURATION (set up output tables) utility here! |
Software Home | Configuration (WBconf) | Config. Tables | Flash Update | Display Config
|
The AFR Tables tab of the WBconf utility is used to configure the software programmable outputs.
|

Version 3 controllers (including 3A, 3B, 3E, 3H, etc. as of Jan 2007) have a WBlin driver capable of producing 8.192 Volts rather than the 5.00 volts of earlier models. If you have one of these models it is vitally important that you check the 3x model? checkbox at the top left of the AFR Tables tab - the WBlin tables generated will be scaled by 5.00/8.192 = 0.61035. Failure to do this will produce higher than expected voltages on the WBlin outputs of the version 3 models. |
|
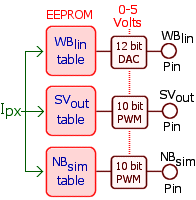
Output Table ProgrammingEach WBo2 physical output pin (brown circles in the image at left) has an associated 65 word (130 byte) EEPROM lookup table to translate the derived Ipx (normalised pump current) into a value that is later converted to an output voltage. Outputs are buffered and cover the full range of 0 to 5 Volts (0 to 8.192 for version 3 models). Accuracy of conversion to the output voltage depends on the conversion technology :
Regardless of output technology, the tables are the same and use 12 bit numbers with a range of 0 to 4095 (0x0000 to 0x00FFF) and are accessed in Intel format (LSB, MSB). Zero represents 0.00 Volts, and 4095 represents 5.00/8.192 Volts. |
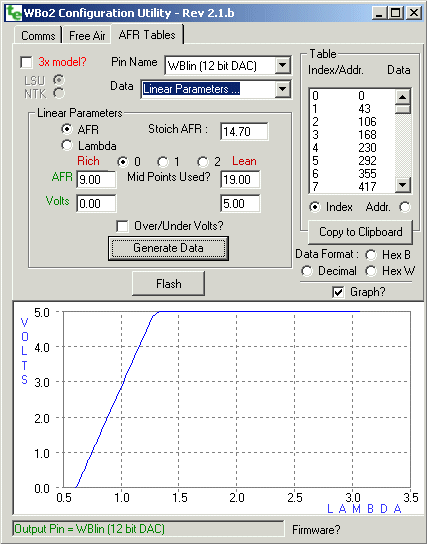
Output Pins and their TablesRefer to the screen image at right. The drop down list box labeled Output Pin Name : and showing WBlin (12 bit DAC) selects the physical output pin that will be re-programmed. There are just three pins that can be re-programmed (ie. WBlin, SVout & NBsim) and you should refer to the relevant hardware description to determine the actual pin used. Remember : each pin has a re-programmable table associated with it. Immediately below it, the drop down list box labeled Output Data : is highlighted and showing Linear parameters .... The values that may be set are shown below in the linear parameters frame (these are discussed fully below). The available data sources for the table are itemised below :
Note that designations SVout & NBsim used here refer to the default programming of the tables. It is quite possible to re-program the SVout pin to have a linear format, either the same as the default WBlin output, or another, say, a reversed linear table from 5 to 0 volts. Generating Tables & Flashing ThemDepending on the table you select, if it's a fixed format it will be generated automatically, or you may be required to press the Generate Data button as shown for the linear parameters table at right. The last step in the process is actually flashing the table by pressing the flash button. Strictly speaking, the EEPROM (Electrically Erasable PROM) is written rather than flashed. Unless you have selected an output pin, and data for the table, the flash button will give an error message when used. Remember the Graph? check box is useful to see if the output data you have requested looks like what you have asked for. Only the Lambda range from .6 to 3.1 is actually shown on the graph but this range 99% of people will use. DOn't foget to press the Generate Data if you change some of the setup parameters. |
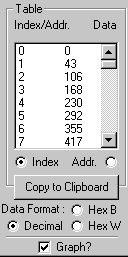
Displaying & Saving TablesAt the right side of the screen (shown at left) is the Table frame. This is used primarily to check and save the generated table. The large central two column listbox shows the internal structure of the table in a number of formats. The left column displays either the Index of each entry (0..64) or its physical Address (in hex format) as it is saved in WBo2's EEPROM memory space. The right column shows the data at each location in one of three Data Formats, either Decimal, two Hex Bytes or, one Hex Word. Remember that bytes are stored in Intel format with LSB byte first (Little Endian), so the byte and word formats appear reversed. The Copy to Clipboard button does just that, removing any existing objects in the clipboard, and copying the 65 lines of text, representing the table, from the listbox. The Graph? checkbox replaces the alternative table data view with a simple graph of the table over the working range of the controller. A graph of the default linear function is shown the the previous image above. |
Programming Linear Parameter's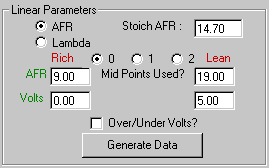
At right is shown the default Linear Parameters frame. Starting from the top left are two radio buttons, one each for AFR and for Lambda. Select the type of units you wish to use. If you use AFR then you can enter the Stoic AFR which by default is 14.70. Remember that WBo2 is a Lambda meter, and when specifying AFR values you must also specify the AFRstoich for the fuel you use. Stoich (or the stoichiometric point) is the point at which all available fuel has combined with all available oxygen, leaving an excess of neither. At stoich Lambda is always 1.00 for all fuels. AFRs less than AFRstoich are rich, and those above are lean. 
There is a simple relationship between AFR and Lambda, as shown in the box at left. Unleaded is commonly assigned a stoich AFR of 14.7 (more commonly 14.57 in European literature, but we use the 14.7 convention). Selecting the other radio button converts between Lambda and AFR units using AFRstoich value. 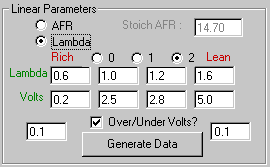
Ignoring the 0, 1, & 2 radio buttons for the moment, observe there are two sets of Lambda/AFR (upper box) and Volts co-ordinate points, one in the Rich and one in the Lean region. Simply specify these end points and press the Generate Data button to produce the table. The parameters shown are for the default WBo2 WBlin output. The rich Lambda/AFR should have a lower (richer) value than the lean Lambda/AFR otherwise an error message AFR/Lambda must increase left to right will be shown. The 1, & 2 radio buttons allow either one or two extra mid-points to be programmed between the two end points. Becasue of the need for most real logging devices to have a unique voltage for every possible lambda value, the midpoint voltages chosen are checked to ensure they are between both the Lambda and Voltage levels chosen otherwise the error message Invalid midpoint Voltage will be shown. The Over/Under Volts? checkbox can be used to force a different voltage outside of the range programmed by the rich to lean values described above. Checking it will display two extra boxes that are used to enter the voltage the controller will generate below the rich Lambda/AFR (the left value) and the above the lean Lambda/AFR (the right value). |
If you want to program a custom table we suggest you contact us for the latest details (June 2007). Most applications do NOT need a custom table, so firsly check the above information.
Knowing the relationship between Ipx and Lambda (or percent of oxygen) enables a custom table to be generated. The text file lsu_ipx_LP.txt (or the eXcel version), or this eXcel file of the default tables programmed into WBo2 units, can be used as the basis of these tables. The following shows three selected parts of this file ...
Ipx Lambda Index AFR (14.7) % O2 (F/A=20.9%) 0 0.6090909 0 8.9536 - Richest 128 0.6194399 1 9.1058 - . . - . . - 3968 0.9816769 31 14.4307 - 4096 1.0090000 32 14.8323 - Near Stoich 4224 1.0412468 33 15.3063 0.703 4352 1.0784486 34 15.8532 1.406 4480 1.1204268 35 16.4703 2.109 . . - . . - 8064 137.6577167 63 2,023.5684 20.283 8192 207.0000000 64 3,042.9000 20.900 Free-air |
Note that three special areas of the table are highlighted.
We update this documentation from time-to-time in response to your Feedback.